
 Admit it, you’re in love with those beautiful infographics we so often see in newspapers, magazines and online. They convey an idea, concept or statistic in a visual way that is frequently easier to understand that plowing through text. It’s lazy, but oh, so true.
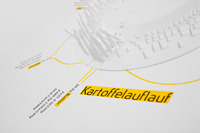
 Now a Shapeways designer has produced a kind of 3D infographic. Johannes Tsopanides used data for food CO2 content, nutrition and cost to design a 3D model that visually portrays this information. You simply print the model and place it over a paper with additional explanatory written information.
Yet another very innovative use of data to produce something in 3D. What’s next?
Via Shapeways