

Companies with fleets of industrial 3D printers could get much value from a new module in Authentise’s 3DIAX suite: analytics.
Authentise has been developing networkable solutions for 3D printing applications for some time, and their 3DIAX cloud platform has been providing a number of useful functions to those operating multiple pieces of 3D printing equipment.
Up to now, much of their capabilities have been regarding the handling of 3D models submitted for 3D printing, providing such features as mesh healing, optimizing support structures, print orientations, secure printing and similar. However, their latest addition is a bit different and I believe it could be of significant value to anyone running a fleet of 3D printers.
The new capability is “Machine Analytics”, which provides statistical analysis of 3D printing activity and presents it through a dashboard interface.
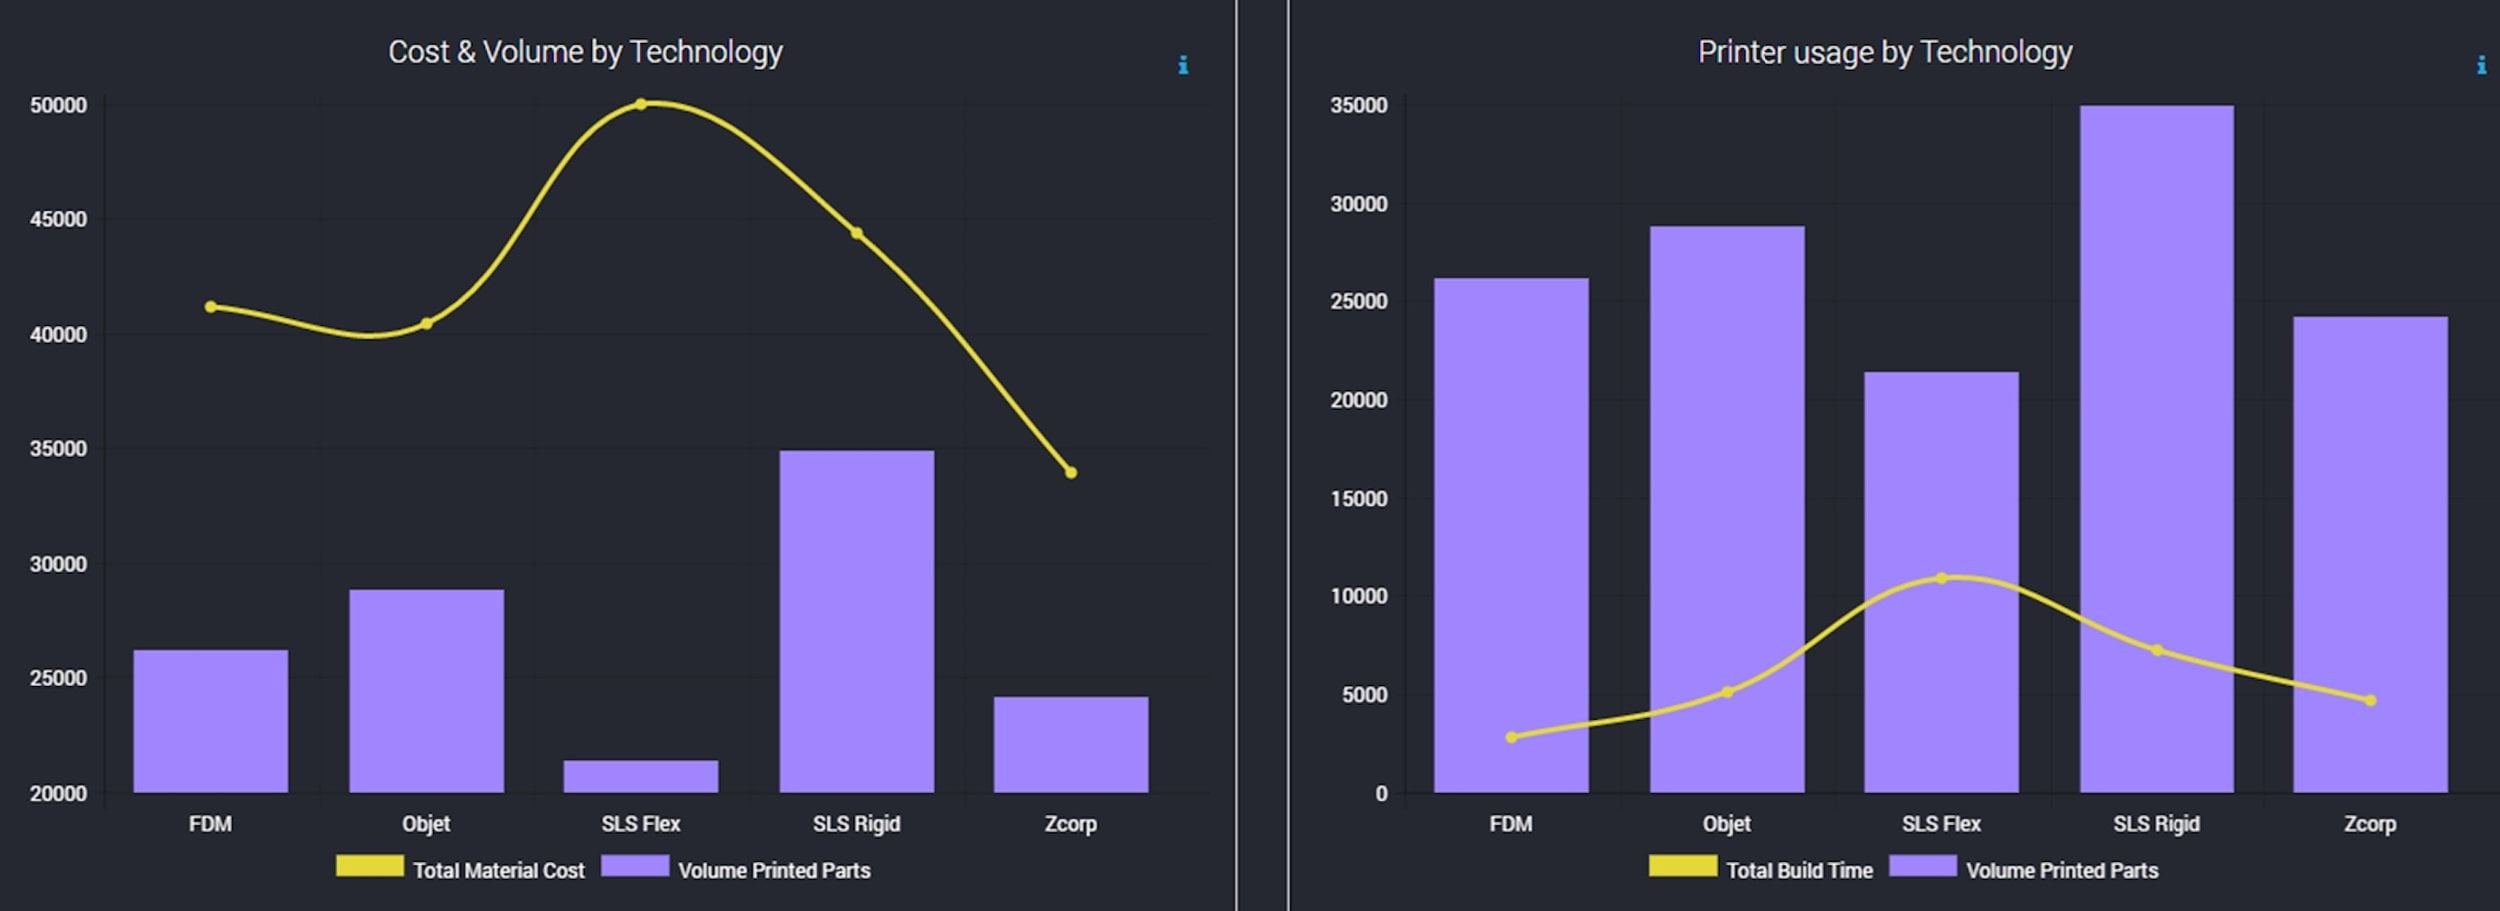
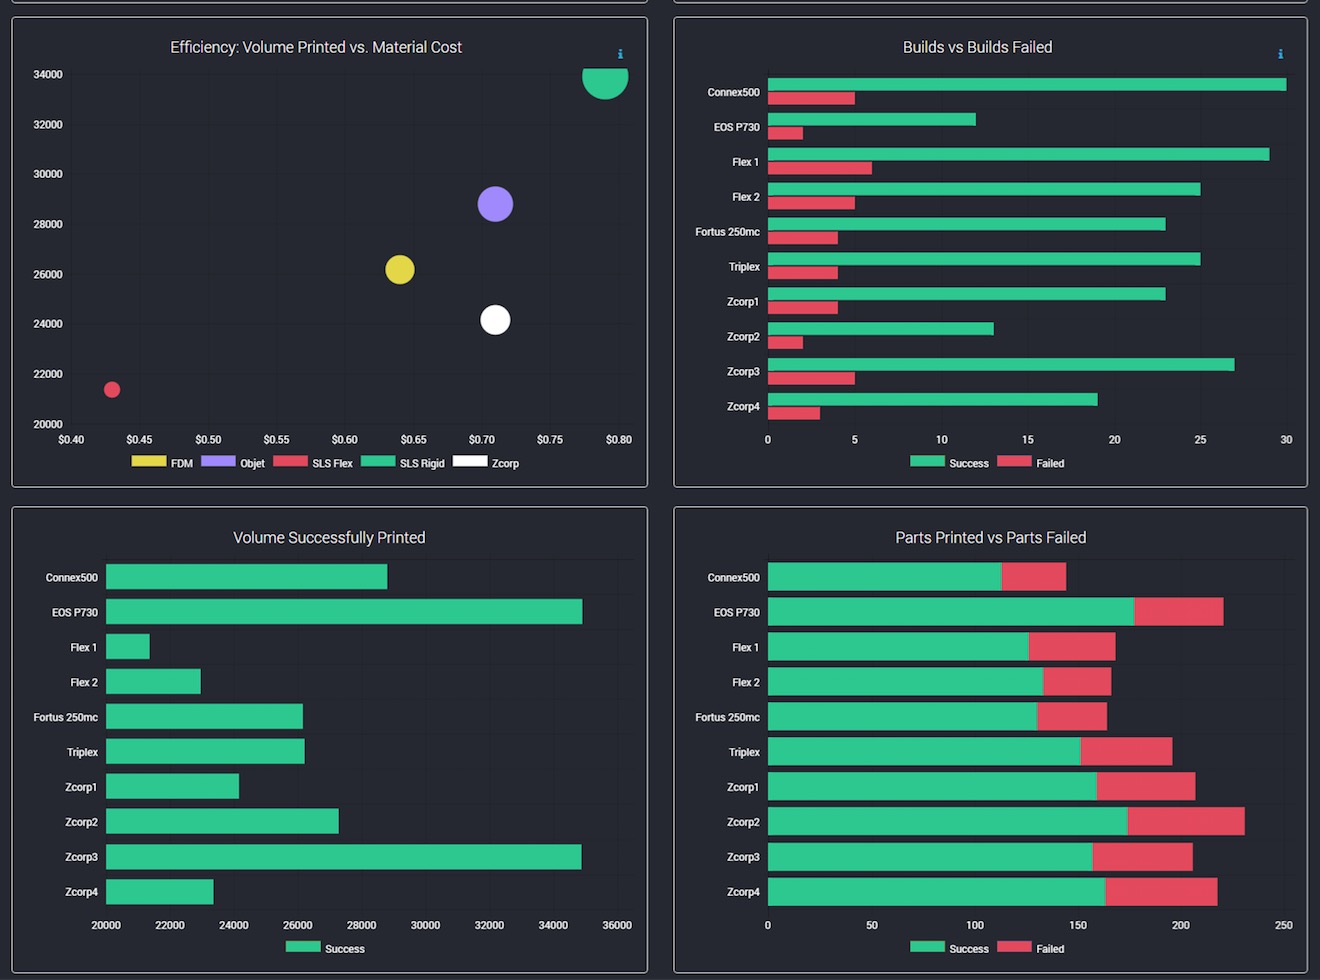
Here we see some of the outputs. “Cost & Volume by Technology”, for example, provides tremendous perspective on the use of different 3D printing technologies. The “Printer Usage by Technology” chart provides similar perspective, but from a different statistical view.
Such charts are critical for any efficient operation, as they can visually show precisely how the expensive equipment is operating. Inefficiencies can be identified and dealt with, to provide a more profitable operation in total.
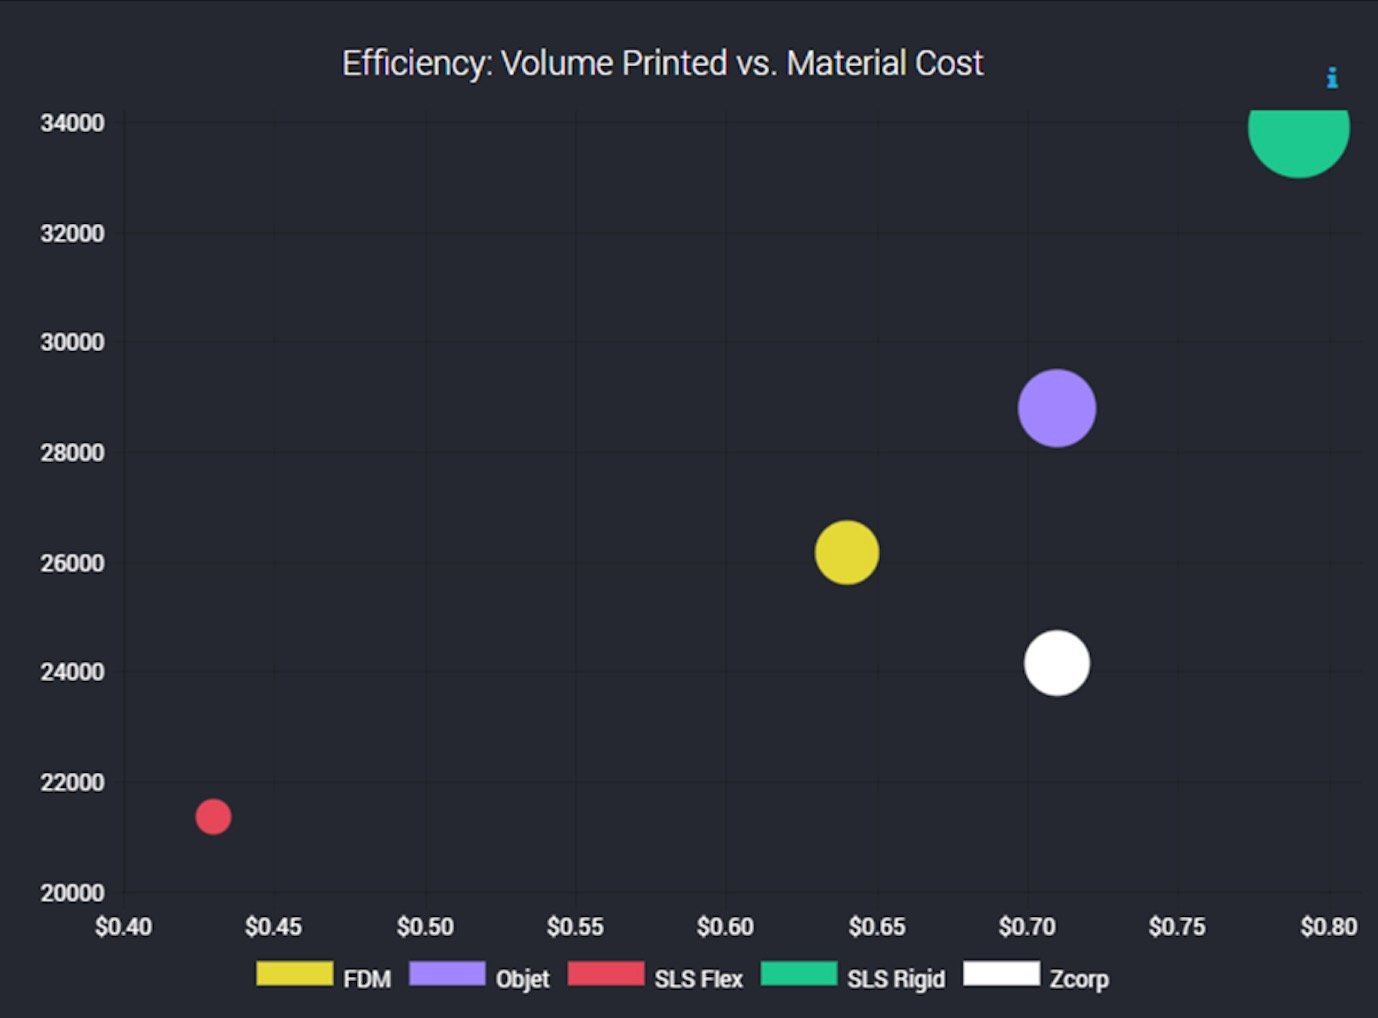
The “Efficiency Volume Printed vs Material Cost” chart shown here can show if the most profitable equipment is being used effectively.
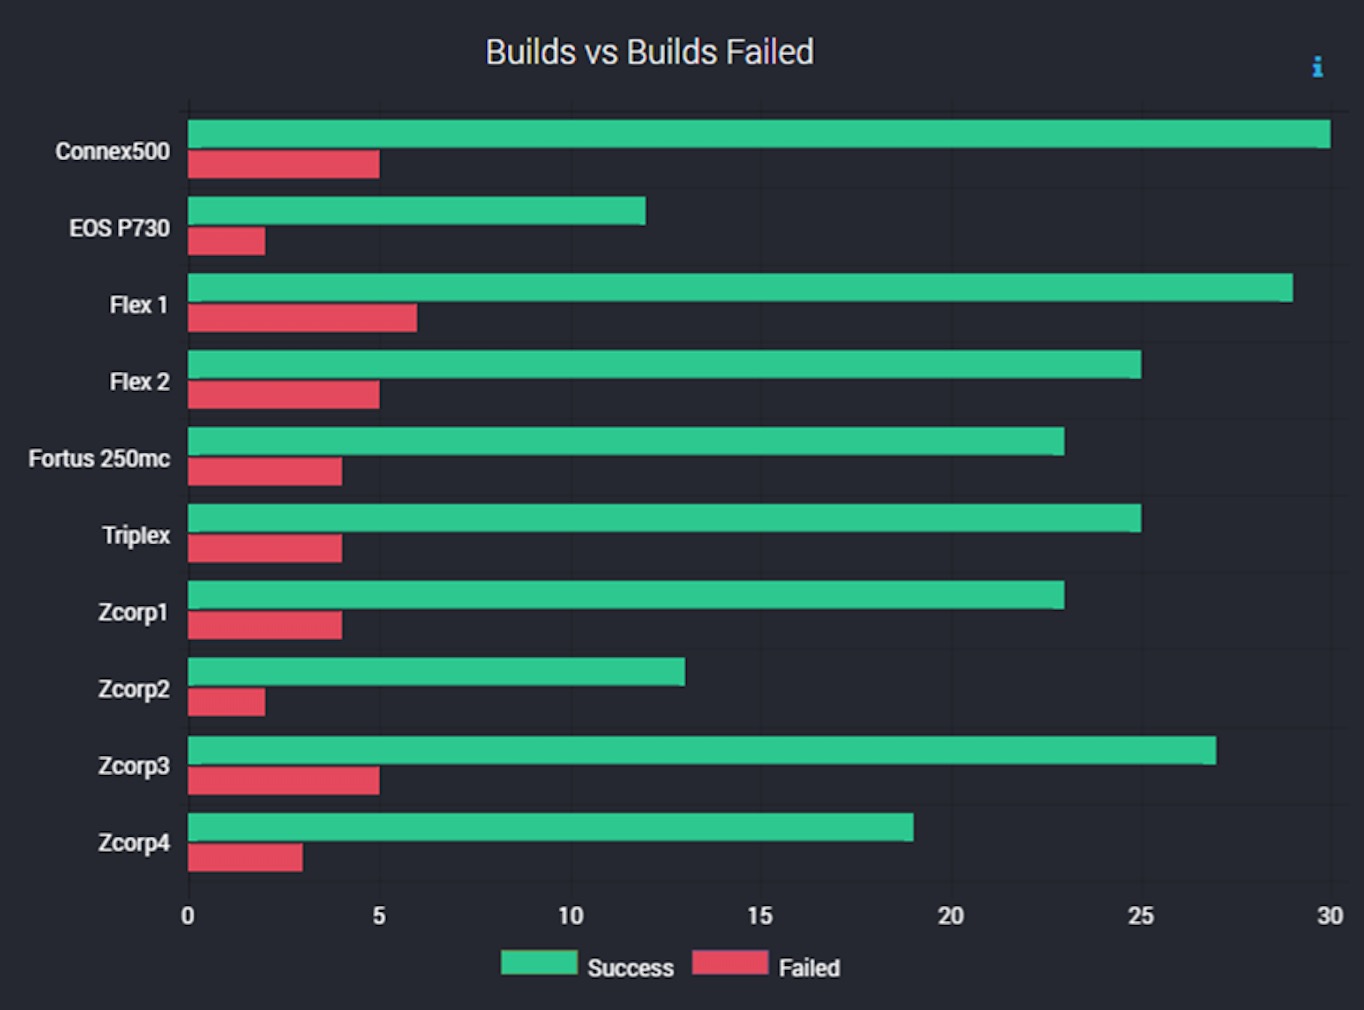
There are a number of charts tracking print failures, too. These are critically important because any amount of time a machine is down is time that it isn’t producing revenue. That means the charge out rate must be higher to compensate for the loss, and the chart helps determine the necessary course of action.
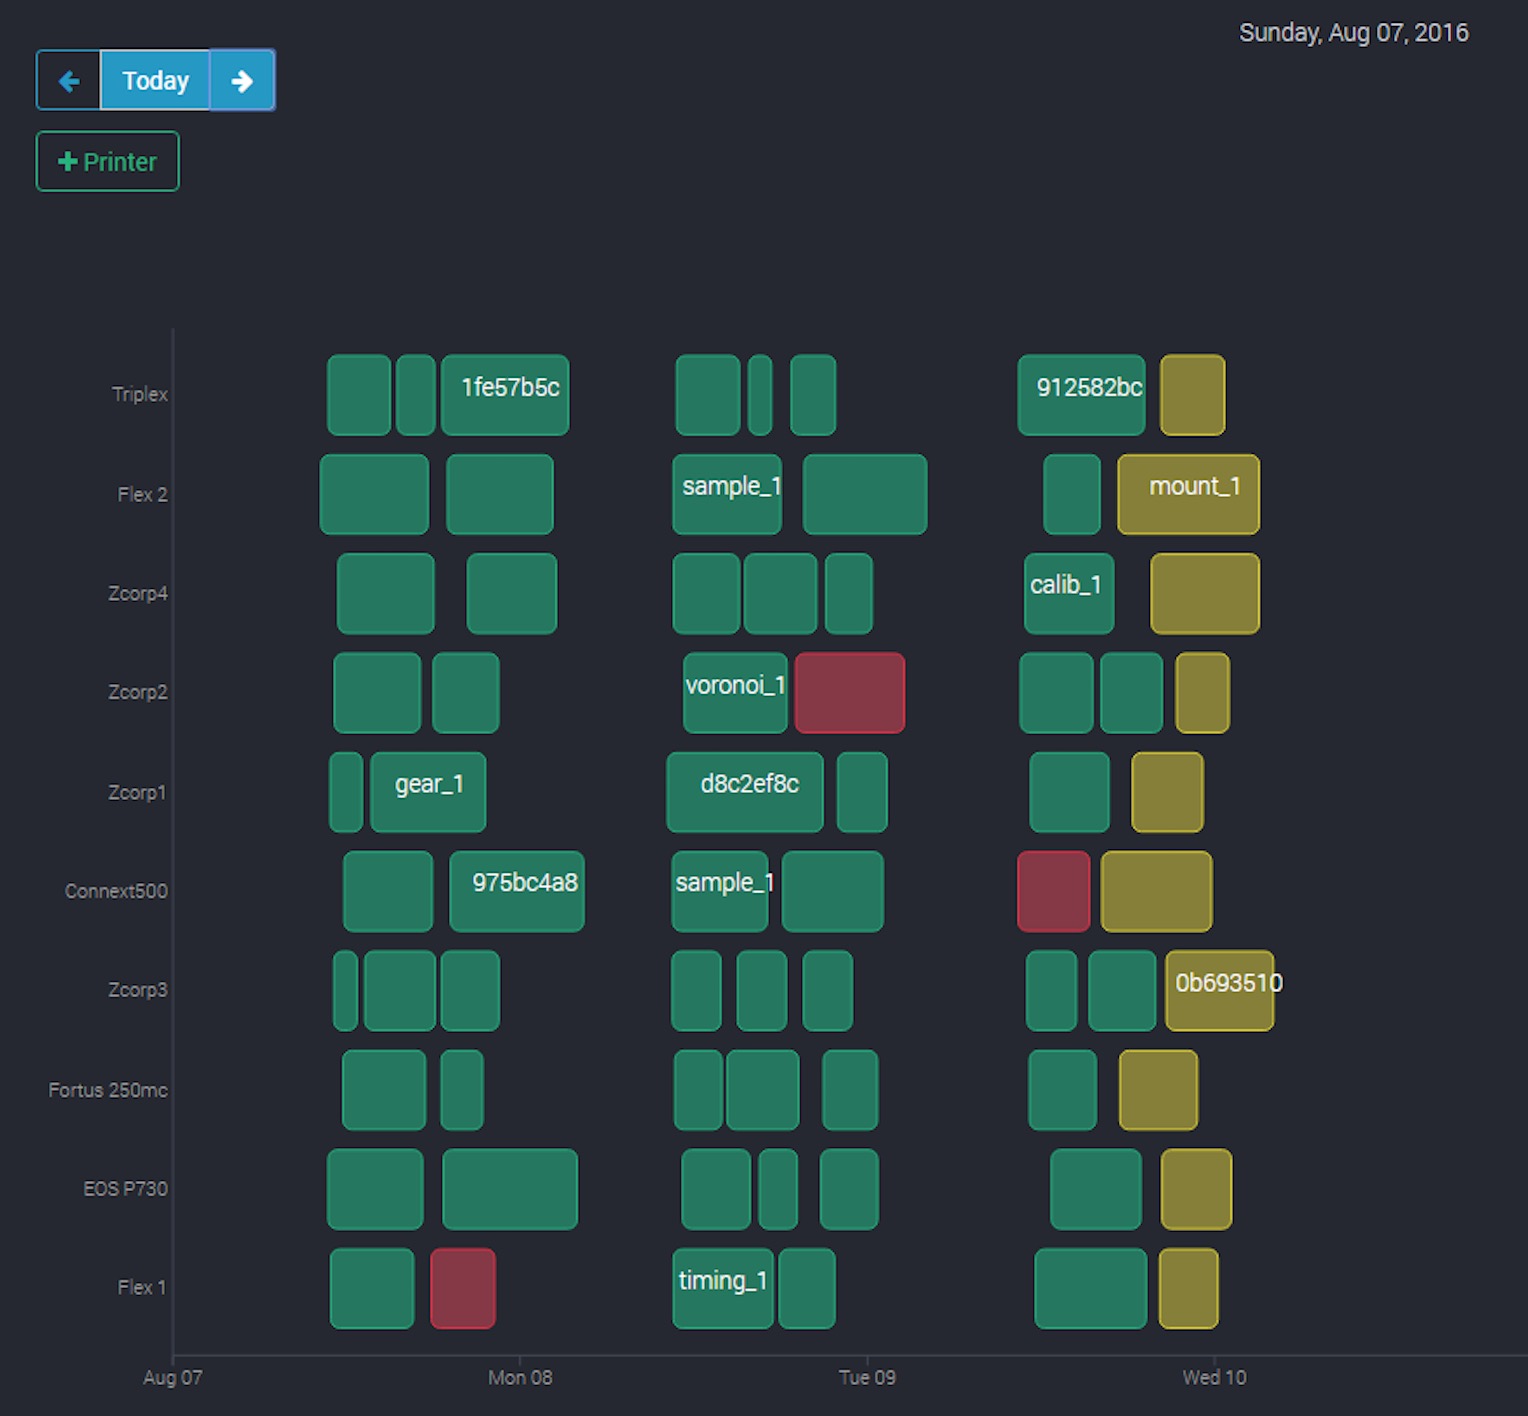
A timeline view shows which machines have been active, which prints were successful and which failed. Again, the efficiency of each machine is easily visualized.
Authentise explains that such information can be accessed through a programming API. This means that a company could extract such statistics to perform additional independent analyses, for example. But more importantly, the stats could theoretically be directly plugged into an ERP for inclusion in a normal billing system.
One final thought on this new module. It occurs to me that because this is a cloud service, it means that Authentise would have their hands on a great wealth of information regarding the efficiency and effectiveness of many different types of industrial 3D printers. That is of great potential value, as it might show which models tend to have the most failures, for example. It would be clear, by analyzing their database, which machines are the most reliable.
Via 3DIAX